How to increase the click through rate of advertisement, you must first understand the click through rate model
Source: Shangpin China |
Type: website encyclopedia |
Time: November 25, 2015
When it comes to computing ads, personalized recommendations, and even general Internet products, the most important indicator, whether it is operations, products, or technologies, is click through rate. There are also some stories in the industry. By establishing a better click rate prediction model, scientists have brought hundreds of millions of incremental revenue to the company. Why should click rate, a simple and direct statistic, be characterized by a complex mathematical model? How is such a model established and evaluated? Beijing Website Design The company Shangpin China will talk about this issue in this issue.
So what is the click through rate model?
In computer science, click model is the modeling of user's click behavior. According to the user's historical click information, the user's interest and behavior are modeled to predict the user's future click behavior and improve relevance.
In search engines, click model refers to the modeling of users' historical click documents to predict document relevance.
Webpage SEO Search sorting is traditionally based on manually designed sorting functions, such as BM25. In recent years, the introduction of sorting learning has greatly reduced the complexity of integrating a large number of features. However, because sorting learning is supervised learning, a large number of manual annotation personnel are required to annotate documents, which requires a large amount of labor costs Marketing website construction The relevance of web pages will change with the update of web pages, especially for news pages with timeliness. It is not feasible to keep all manual annotations up to date.
Users' click logs record important information about users' satisfaction with search results, and can provide information with high predictive value for relevance. Compared with manual annotation, the acquisition cost of click is lower, and click always reflects the latest relevance.
1、 Why build a click rate model?
Whether it is manual operation or machine decision-making, we all want to have a prediction on the possible click rate of an advertisement or content, so as to judge which items should be placed in a more important position. It doesn't seem difficult. For example, if I have ten pieces of content that have different click through rates in history, it just needs to make decisions based on the statistics of historical click through rates. It doesn't seem difficult.
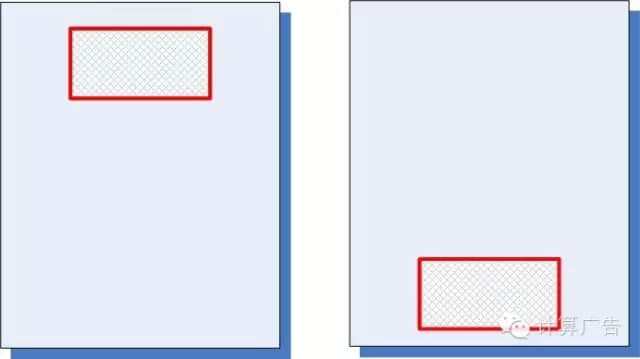
However, it doesn't make any difference. Although the method of directly counting historical click rates is simple and easy to operate, it will encounter a very difficult problem. First of all, we need to establish a concept: without considering a series of environmental factors such as location and time, the absolute click rate level is of little significance. For example, the following advertisement is placed on two positions in the figure. The statistics show that the click through rate of the former is 2%, and the click through rate of the latter is 1%. Which advertisement is better? In fact, we can't draw any conclusions.
 Therefore, the smart operation came up with a way to simply count the click rate at different locations, and then sort them separately. This idea is impeccable in principle, which is equivalent to solving the joint distribution directly; However, its practical value is not high: statistics on each location separately show that the data of most advertisements or content items are too few, for example, 100 displays generate a click. Can we draw a conclusion that the click rate is 1%?
Can we change our thinking and find some key factors that affect the click rate, and make statistics on these factors separately? In fact, this has produced the modeling idea of "feature". For example, advertising space is a factor, advertising itself is a factor, and the gender of users is a factor. It is feasible to count click rates on each factor separately from the perspective of data adequacy. However, this has created a new problem: I know the average click through rate of male users, the average click through rate of advertising position S, and the average click through rate of advertising position A. How can I evaluate the click through rate of a male user seeing advertising position A on advertising position S? The intuitive method is to find the geometric average of the above three click rates. However, there is an implicit assumption that these three factors are mutually independent. However, when there are more features, such independence assumption is difficult to guarantee.
The independence between features often has a great impact on our conclusions. For example, what is the reason for the rising incidence of cancer in China? Or the reason for the "average life" factor? Obviously, these two factors have some correlations, so simple separate statistics are often impractical.
So what should we do? This requires statisticians and computer scientists to set up a click rate model that comprehensively considers various features and adjusts it according to historical data. This model should not only consider the correlation of various features, but also solve the problem of the sufficiency of each feature data, and also be able to automatically train and optimize on a large number of data. This is the significance of the click rate model, which is a great, glorious, correct work with great practical value and strategic significance in the era of Internet+and big data. That said, is it necessary to lift it so high? Of course! Because I'm a little more proficient in this craft, I don't like to talk about it.
2、 How to build a click rate model?
This question is relatively simple, so we won't talk about it any more. (Readers who want to scold the street, please stay calm and continue to read.)
3、 How to evaluate a click through rate model?
There are various qualitative or quantitative, online or offline methods to evaluate the click rate model. However, no matter what kind of evaluation method, its essence is the same. It depends on the difference between the model's clicked display and the one not clicked. Of course, it would be great if we could find a quantitative index that can be calculated offline.
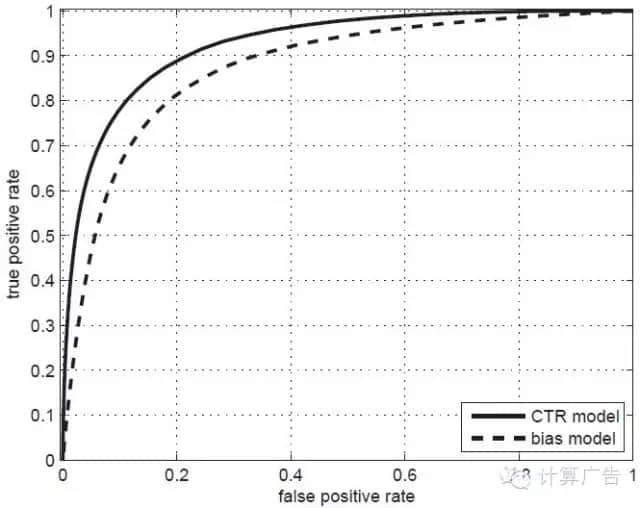
One such indicator is the area under the ROC curve as shown in the figure below, which is called AUC in terminology. (For a detailed introduction to ROC and AUC, please refer to Chapter * of Computational Advertising.) The larger the AUC value, the stronger the corresponding model differentiation ability.
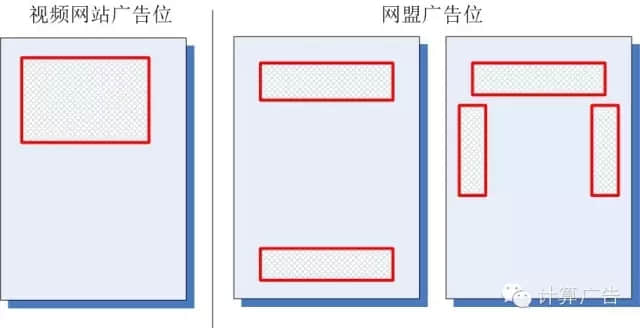
 Well, in order to give you a deeper understanding of the key to click rate model evaluation, we want to talk about a common spat: one day, two engineers were chatting, one named Xiaoyou and the other Xiaodu. They are respectively responsible for the click rate modeling of a video website and an online league advertisement. Xiaoyou said: I have been busy recently. A new click rate model has been launched, which has improved the AUC from 0.62 to 0.67. The effect is really good! However, Xiaodu laughed: this data is also good for you to say that our AUC has already exceeded 0.9!
So, is it true that a small model is so much better than a small optimal model? Of course not. If we look at the distribution of advertising space of the video website and NetUnion, we can see it at a glance.
 what? You haven't understood yet, so I suggest you think about this problem yourself. Whether you are an operation or a product, after such thinking, your data interpretation ability will reach a higher level.
Well, after finishing the three key points, I know that some readers will still fail to understand the second point, so let's just say a little more and sort out and publish below the sharing content entitled "Analysis on the Trend of Hitting Rate Estimation" that Wang Chao made in the WeChat group of computational advertising readers on November 15, 2015. Code farmers who have not insisted on closing the article here, let them regret it for a lifetime!
Today, let's share some trends in click through rate estimation in recent years. Mainly combined with some guidance from Mr. Liu Peng, as well as some experience in his own work, please correct any bias.
In the first edition of the book, we mainly talked about the classic hit rate prediction model logic regression, feature engineering, model evaluation, etc. We believe that this step is a necessary baseline version for most scenarios. Later, more detailed feature engineering and modeling can be done on this basis. Considering that all the friends in the group have already got the book, today we will skip the content covered in the book and talk about some parts that are not mentioned in the book at present. If you don't know enough about the contents of the book, it is suggested that you should carefully master the basic contents of the book as the first step.
Source Statement: This article is original or edited by Shangpin China's editors. If it needs to be reproduced, please indicate that it is from Shangpin China. The above contents (including pictures and words) are from the Internet. If there is any infringement, please contact us in time (010-60259772).


