With the wide application of network planning technology, many types of Website Design , network diagram, etc. According to different drawing symbols, network diagrams can be divided into two categories: double code network diagrams and single code network diagrams. The double code network diagram uses arrows to represent processes, events to represent the connection points between them, and event numbers i and j to represent the name of a process. The single code network diagram uses nodes to represent a process, and arrows to represent the logical relationship between processes. According to the scope of research objects of network diagram, it can be divided into general network diagram, sub network diagram and curtain layer network diagram. The general network diagram comprehensively reflects the beginning and end of a planned task, which is concise and comprehensive. The sub network diagram is a network diagram prepared with a part of the whole planned task as the object. If product design is a part, the design department must further specify it and draw a design work network diagram. Tomb layer network diagram is a network diagram that reflects a certain local production process with the process as the object. It is more specific and can directly guide the production activities at the grass-roots level.
According to the final goal of the network plan, it can be divided into two categories: single objective network diagram and multi-objective network diagram. The ultimate goal of a single objective network diagram is only one, such as building a building, trial manufacturing a new product, overhauling a device, etc. The ultimate goals of the multi-objective network diagram are several, such as producing several different kinds of products at the same time, completing the construction task of a building group, etc. According to the estimated nature of the operation time in the network diagram, it can be divided into two types: positive type and non positive type. Affirmative network refers to that it is possible to estimate the exact value of each operation time, while non deterministic network refers to that it is difficult to estimate the exact value of each operation time. Instead, the shortest, longest and most likely durations are estimated respectively, and then the weighted average operation time is calculated. The following is a comparative analysis of the single and double code network diagram.
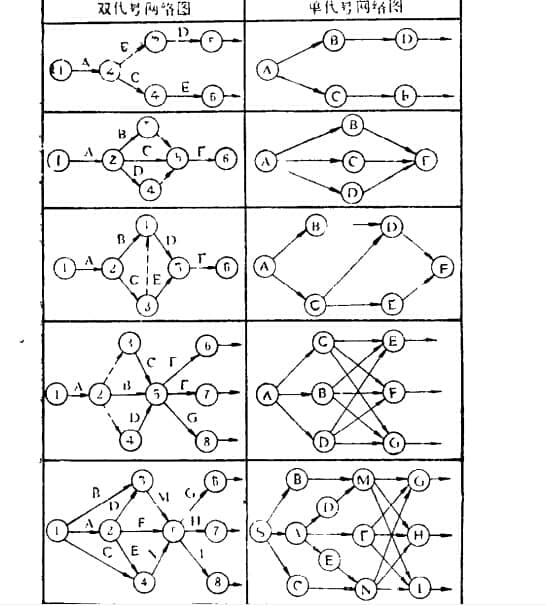
1. Double code network diagram. We use an arrow line to represent an operation. The operation name is written on the arrow line, and the time required for the operation is written below the arrow line. The arrow tail indicates the beginning of the process, and the arrow indicates the end of the process. The arrow and the arrow tail are marked with circles and numbers. The numbers in the front and back circles represent the name of the process. Since two numbers are used to represent a certain process, this representation method is called double code network diagram. 2. For the single code network diagram, we can use a circle to represent a process, and write the process name in the circle. The arrow is only used to indicate the sequence relationship between processes. Since only one number is used to replace a certain process, this representation is called single code 3. To illustrate the difference between single code network diagram and double code network diagram, take a group of processes A, B, C, D, E, F... as an example, draw single code network diagram and double code network diagram respectively for comparison and reference, as shown in Table 2-1.
Double code network diagram and single code network diagram have their own advantages and disadvantages. For beginners, single code network diagram is convenient to draw, understand and modify. Therefore, many new network plans, such as CNT, DCPM, GERT, etc., are based on the single code network diagram. The logical expression of the double code network diagram is relatively clear. If necessary, the length of the arrow line can be used to reflect the time. However, when the logical relationship is complex and virtual processes must be added, beginners often have some difficulties. However, for factories and enterprises to apply the critical path method, the double code network diagram should generally be used.


