Traffic report of Google Analytics
Source: Shangpin China |
Type: website encyclopedia |
Date: March 20, 2012
Beijing website construction The company still sells products in China: Visitor path analysis has always been a weakness in Google Analytics until the V5 version appeared. The visitor flow function makes path analysis no longer difficult! Google Analytics also has a complete and independent analysis capability from traffic, content to transformation. This article will introduce the visitor flow function in Google Analytics V5 in detail, and use personalized content group settings to set Website production The path in the.
I. Planning content group based on analysis purpose
Visitor path analysis based on content groups, as the name implies, we need to group the content of the website before starting the analysis. So, how should we group the content of the website? Is there any standard? Is it grouped by website channel, content type, or page level? How fine is the granularity of each content group appropriate? All of these have no standard answers, and there is no unified standard for dividing content groups. Each website, even everyone's division method will be different. There is no right or wrong or good or bad, as long as the content group you divide can meet your analysis needs and achieve your analysis purpose. Therefore, before dividing content groups, we need to clarify the purpose of the analysis.
The purpose of analysis is simply to say what problems we need to solve through analysis. For example, for my blog, our question is how to increase the number of subscriptions. The question of how to increase the number of subscriptions is pushed back to the content of the website, which breaks down into many specific problems:
1. Is the homepage layout reasonable?
2 Is the information in the article list page valid?
3 Are the results provided by the site search valid?
4 Are the recommendations on the article page effective?
These problems can be further decomposed into more specific problems. For example, what pages did the visitors go to from the home page? Is the sorting rule of the list page reasonable? How many visitors choose to turn pages? Where did the visitors who did not click the search results on the site go? wait. These specific questions are our analysis purposes. After understanding the analysis purpose, we can start to create content groups.
II Preparations before creating content groups
The first step in creating a content group is to become familiar with the site's content and page URL rules. What are the URL rules for different content. This is a very important step and the most time-consuming and laborious step in the entire process of creating content groups. And most of the time, it needs repeated adjustment. I used to create content groups for two very familiar websites. But none of them were successfully completed at one time. There are two main problems encountered here.
1. The rules of website URL are confused and the hierarchy is unclear. This is mainly due to the initial URL planning problem, or SEO to optimize the URL structure.
2 The content group's coverage of URLs is not comprehensive, and new URLs outside the rules are always found. This is mainly because the collation of URLs is not comprehensive.
According to previous experience, we must make preparations before starting to create content groups. These preparations can avoid confusion in later reports to the greatest extent.
1 Organize and understand website URL
The first step of preparation is to organize all the URLs in the website. There are three ways to obtain all the URLs of the website:
1 Export the list of website URLs from the technology or website administrator.
2 Export the URL list of the maximum time period from the existing analysis tool.
3 Generate URLs according to URL rules and verify them one by one.
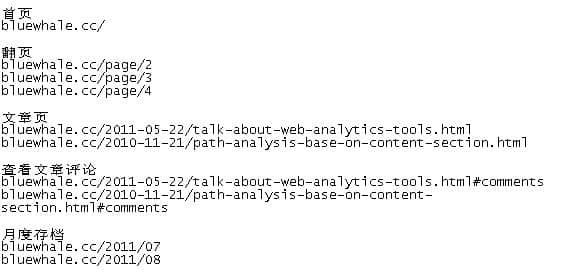
The first two methods can quickly obtain most URLs of websites, but they are troublesome in post sorting and classification. The third method is complex at the beginning, but it is simple in classification and can avoid URL omission. (The prerequisite is that the URL rule hierarchy of the website is clear) The following is a list of some URLs of my blog.
2 Group website URLs
After obtaining most URLs of the website, we can start to group URLs and set a name for each group. The grouping criteria are specific analysis requirements, that is, the problems we want to solve through analysis. How detailed the most basic questions are, how detailed the grouping should be. For example: for the analysis purpose in the previous example. We need to separate the homepage of the website as a group to analyze the diversion of the homepage. Take the first page of the list page as a group to analyze the sorting rules of the first page of the list. The subsequent pages of the list are grouped to analyze the page turning of visitors on the list page. wait. At this time, you may find that you have created many groups, and the rules of each group are different. Some groups have only one page, some groups contain one channel, some groups only record certain specific behaviors of visitors, such as page turning, button clicking, messages or subscriptions, and some groups record errors in the website, For example, 404 pages, search failure pages, etc. None of this is a problem. Only grouping can meet our analysis needs. The following is the departmental content grouping of my blog. I have created 20 groups for the content of my blog, while in another company level website, I have created 80 groups.
3 Convert to regular expression
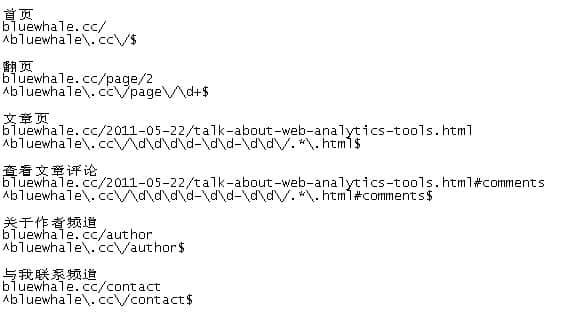
After grouping all URLs of the website, we need to convert each grouping into a regular expression. This work is somewhat complicated. It is necessary to ensure that each regular expression does not miss all URLs in the group, nor can it match the URLs of other groups incorrectly. There is no trick here. Select a typical URL from each group and put it together for testing. Recommend a very useful regular expression working Rubular. This tool can improve the efficiency of creating regular expressions. The following is the regular expression of some URL groups in my blog.
III. Creating content groups using filters
Content groups are generated by aggregating existing URLs through search and replace filters. The newly generated content group will overwrite the Google Analytics popular content report, so we need to create a new duplicate configuration file for the content group separately. The page data in this configuration file will only be displayed as the name of the content group. You can call this report "Content Group Path Analysis Report".
1 Create a new profile
The method of creating duplicate configuration files is very simple, and will not be repeated here. Just pay attention to the following points.
1 Same configuration as the main report application, including time zone, filter and other settings.
2 Websites with subdomains must set a filter for adding host names.
3 Filter the parameters in the URL selectively according to the specific analysis requirements.
4 Do not open the site search report, nor filter out the site search or category parameters.
2 Create content groups one by one
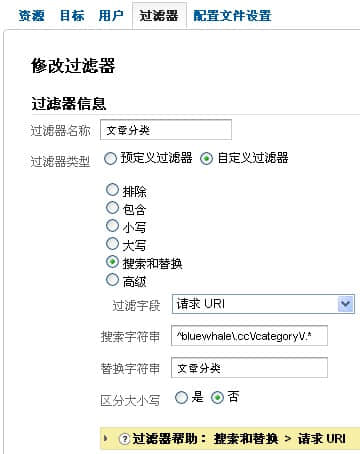
Through the sorting and grouping of website URLs in front, we have divided the content of the entire website into different groups according to the analysis purpose. What we need to do now is to create these content groups in Google Analytics and obtain data. The tool for creating content groups is Google Analytics' search and replace filter. The whole process is simple. Enter the regular expression of the group into the search string and the group name into the replacement string. The filter will filter the URL, and the URL matching the rule of the regular expression will be replaced with the group name in the replacement string.
 IV. Check and optimize the content group
After the content group is created, it cannot be analyzed immediately. Because the data is not accurate at this time. We need to check the content group. The method of inspection is simple. It is to check the popular content report in the configuration file to see if there is any missing URL. The whole inspection process lasts for 3-5 days.
1 Check content groups through popular content reports
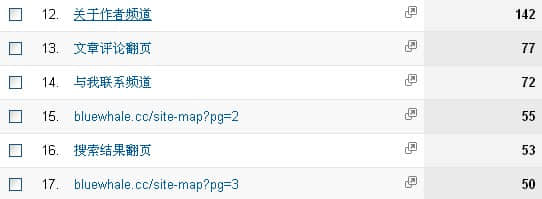
On the second day after the content group is created, check the content group data through the popular content report to see if there is any missing URL. If a page URL is displayed in the content group report, it means that the page has not been matched to the corresponding content group. You need to analyze the reason and adjust the regular expression of the content group. It is obvious from the screenshot below that the page turning of the website map does not match the content group. You need to check the regular expression settings of this content group.
If you create more content groups, here is a quick check method. Sorting the reports by page views can quickly find the URLs that do not match the content groups. The review of content group reports is an ongoing process because
The newly added external traffic often has various strange parameters, which may break the existing URL rules at any time.
2 Order of optimizing filters
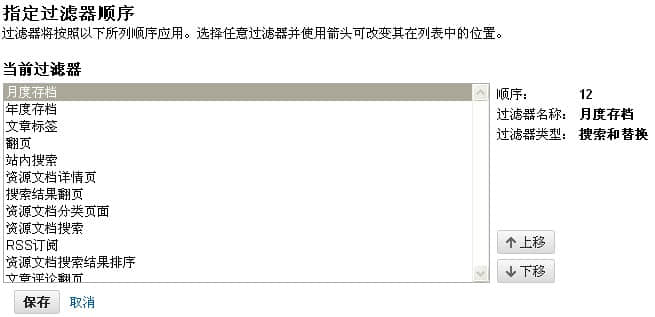
When checking the settings of content groups, in addition to the missing URL check, you also need to check the content groups with conflicts. This situation is not common, and only occurs when the URL rules are confused. For example, if a directory at the same level contains multiple information, when we need to create content groups for each information, the regular expression may have matching errors. At this time, it is necessary to adjust the sequence of filters to ensure correct matching.
So far, the creation and inspection of website content groups have been completed. Next, we will introduce the visitor flow function in Google Analytics V5, and use the created content group with the visitor flow function to analyze the visitor's browsing behavior.
V. Overview of visitor flow report function
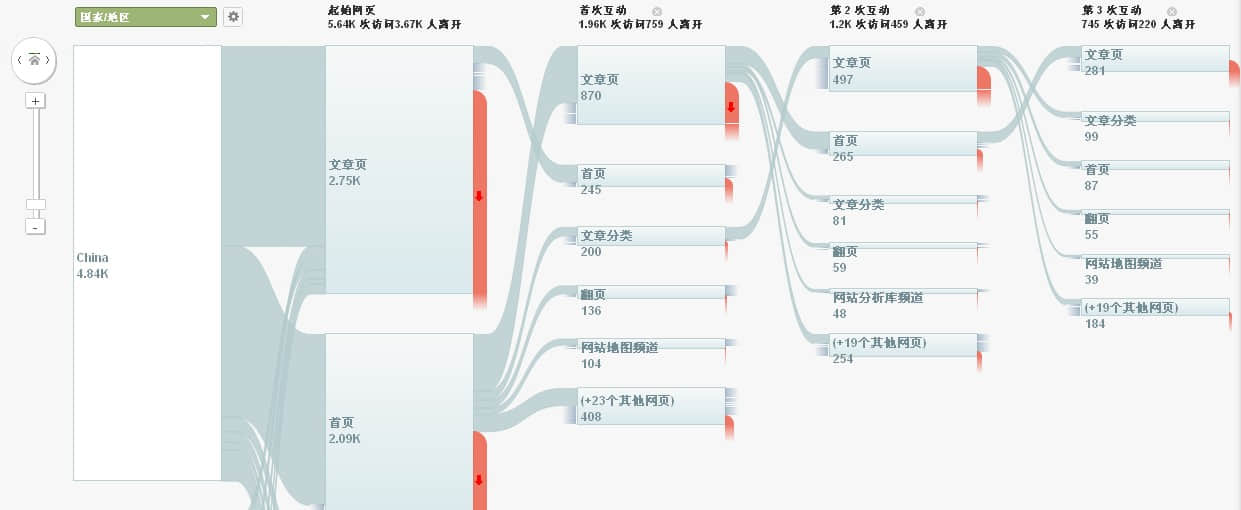
The visitor flow report is under the audience group directory in Google Analytics V5. By default, only the first three interactions after visitors enter the website are displayed. Continue to click the+step link on the right side of the report to view the follow-up interaction until the last visitor leaves the website. After we create a content group report, we can see the interaction between visitors and different content groups here.
1 View three modes of visitor flow
In the visitor flow report, we can view the interaction between visitors and website content in three ways: viewing by different dimensions of visitor sources, viewing by different content groups, and viewing by visitor behavior. Let's explain one by one.
1.1 View by visitor source dimension
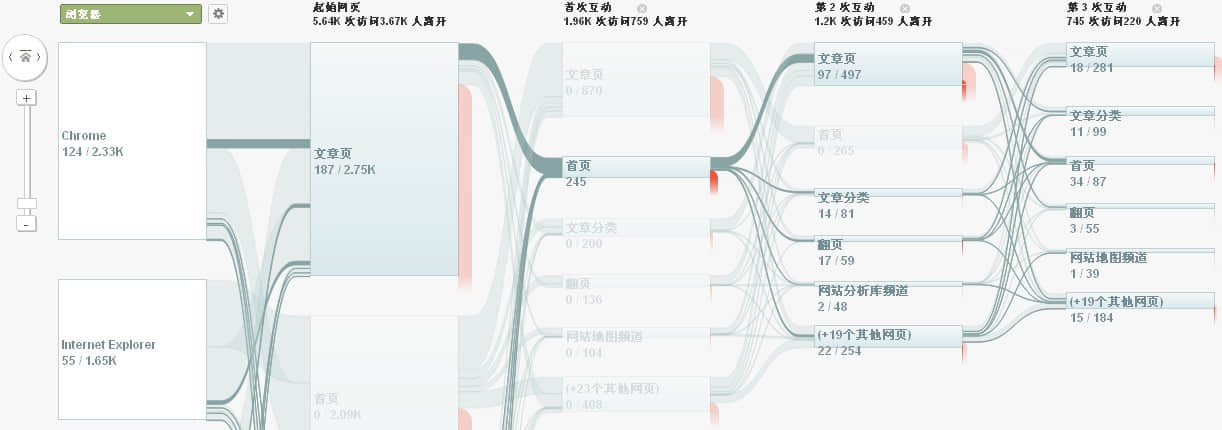
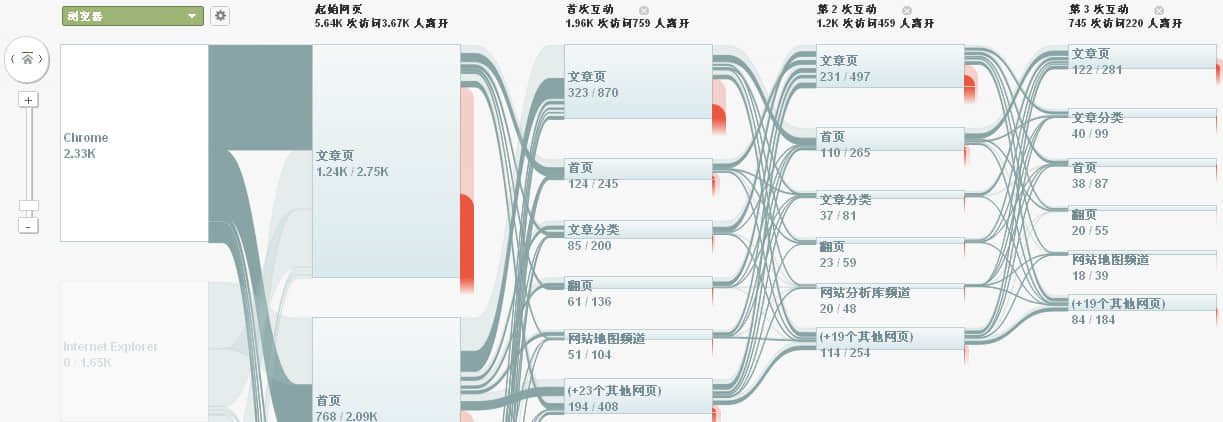 The first mode is to view by the source dimension of the visitor. The visitor flow report provides different dimensions of the visitor. These dimensions include the geographical dimension, source dimension, content dimension and system dimension. We can select any dimension in the report, and select the highlighted way to highlight the traffic here in the displayed sub dimensions, To view the browsing path of visitors in this sub dimension. The above figure shows the browsing path of visitors using the chord browser under the system dimension. You can think of this pattern as the subdivision of access paths according to the source of visitors.
In all the access paths, I found that visitors still return to the home page during the second interaction, which seems inconsistent with my previous assumption. The home page is a navigation page for the whole site. Usually, visitors will return to the home page only when they finish a task or do not know where to go next. So which pages lead visitors to return to the home page? We can continue to use the second mode to view the visitor path.
1.2 View by different content groups
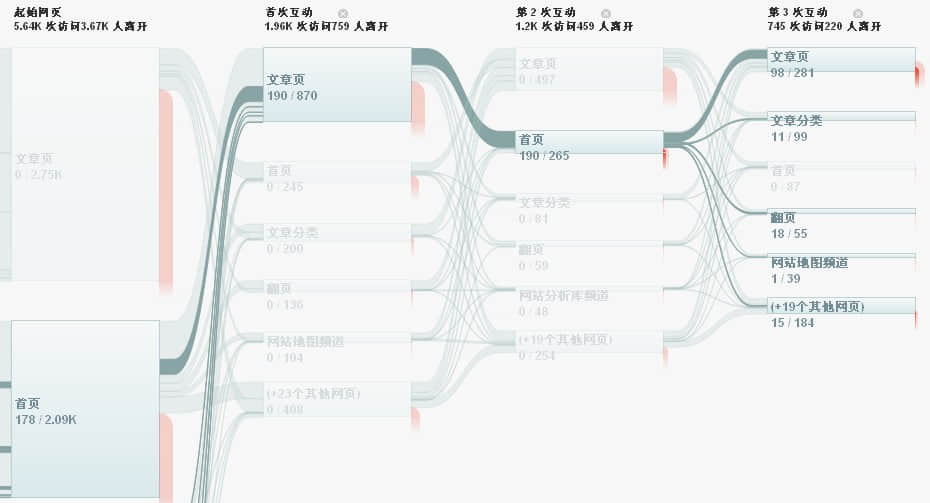
 Similar to the first mode, we can also highlight the path of a specific content group in the report. This is much like the navigation analysis report in the old version of Google Analytics. According to the previous questions, I selected the path of the second interaction with the home page after entering the website in the report. It can be found that the content of the previous step and the next step on the home page are basically the same. The article page occupies a large proportion in the front and back pages of the home page. If visitors return to the home page from the home page and enter a new article page again from the home page, there may be a problem with the relevant article function at the bottom of my article page. The recommended article may not be what the visitors want, or I should also provide other modes of article navigation in the right column of the page to help visitors navigate the article page. Therefore, the question to be determined now is where did the visitors who read the previous article page go through the home page? Let's continue to use the third mode to view the visitor path.
1.3 View by visitor behavior
In the third mode, I chose this part of the traffic from the article page to the home page of the website. Obviously, most of these visitors continued to enter the new article page from the home page, and a few chose other navigation methods. Through the three viewing modes, it can be basically determined that there is a problem with the existing article functions of the article page, and there is also a lack of other navigation methods in the article page. Next, you need to adjust the recommendation rules at the bottom of the article page and add navigation for article categories on the right.
Through a simple analysis, we learned three viewing modes of visitor flow report. Careful friends can find that there are many figures in each step of the report. What do these figures mean? Let's explain them one by one.
2 Numbers in visitor flow report
The numbers in the visitor flow report appear in three places. 1 At the top of the report, each interaction data is displayed. 2 Grey traffic data, showing visitor diversion data. 3 The data of the content group in each interaction shows the performance data of the content group.
Data per interaction
The data of each interaction at the top of the report shows the loss of visitors after each interaction with the website, which is equivalent to a large virtual funnel. The specific calculation method is as follows:
The number of visits to the starting page is equal to all visits to the site. The number of visitors minus the number of people leaving in each interaction equals to the initial number of visitors in the next interaction. The figures in the figure above are:
5640 (website access) - 3670 (number of people leaving)=1960 (first interaction) - 759 (number of people leaving)=1200 (second interaction) - 459 (number of people leaving)
Visitor streaming data
The grey traffic part shows the diversion data of visitors. In the figure above, we can see that China has generated 4840 visits, 2230 of which have reached the article page. The article page received 2750 visits in this period.
Content group performance data
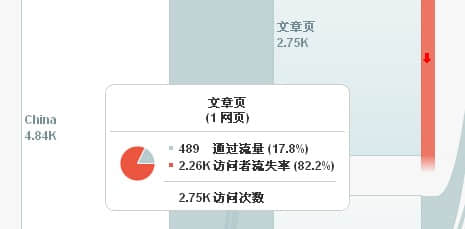
The third group of data is the performance data of different content groups. In the figure above, the content group of the article page has received 2750 visits, of which 82.2% have lost access (the red part behind indicates the loss), and only 17.8% continue to browse.
Six Visitor Flow Reports Used in Combination with Other Functions
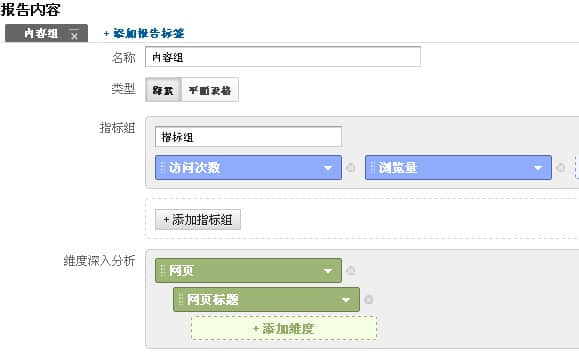
Finally, let's talk about content groups. Visitor flow reports are used together with other advanced applications in Google Analytics. The first is custom reports. After we aggregate the pages, we can only view the browsing volume by the name of the content group. If you want to break down the data of the content group, you can use the custom report function.
1 Use custom reports to break down content groups
In custom reports, you can subdivide content group indicators through page titles. View the distribution of key indicators in each content group.
2 Use advanced segmentation to segment the visitor flow
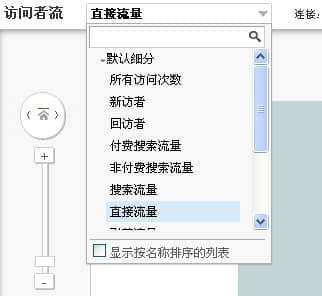
The visitor flow report also supports the advanced segmentation function, which is superimposed with the traffic dimension in the visitor flow. For example, when we select the source in the visitor flow report and direct traffic in the advanced breakdown, the visitor flow report will only display the visitor path of direct traffic.
3. Use visitor level user-defined variables for classification tracking
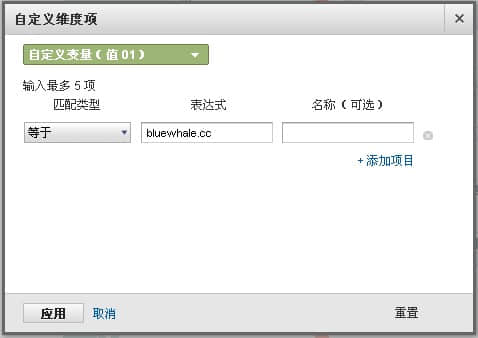
Finally, the visitor flow report also supports the use of custom variables to classify and track visitors. If your website uses visitor level custom variables to identify visitors, you can track the full path of website visits to the preset visitor categories or even an individual of such visitors in the visitor flow report.
This article was published on Beijing website production Company Shangpin China //ihucc.com/
Source Statement: This article is original or edited by Shangpin China's editors. If it needs to be reproduced, please indicate that it is from Shangpin China. The above contents (including pictures and words) are from the Internet. If there is any infringement, please contact us in time (010-60259772).

